Crest Factor of Musical Signals (abstract)
... the result of ASDA (Statistical Analysis of the
Amplitude Distribution) is summarized in a series of numerical quantity
(average, peak, RMS etc.) and a bar chart that represents the normalized
distribution for the amplitude of the signal. For example we can know how many
times the signal takes values close to maximum value (in the track) or for how
long is situated above or below the 50% of maximum… and so forth. The ASDA
"counts" how many times the signal crosses a number of fixed thresholds.
For musical signals thresholds were
established as shown in Table 1.3.
|
|
Modulation
% |
Modulation
dB |
|
1 |
0 to 3.125% |
Till
-24dB |
|
2 |
6.25% to 12.5% |
-24dB
to -18dB |
|
3 |
12.5% to 25% |
-18dB
to -12dB |
|
4 |
25% to 50% |
-12dB
to -6dB |
|
5 |
50% to 70% |
-6dB
to -3dB |
|
6 |
70% to 85% |
-3dB
to –1.5dB |
|
7 |
85% to 100% |
-1.5dB
to 0dB |
Tabella: 1.3 ASDA thresholds
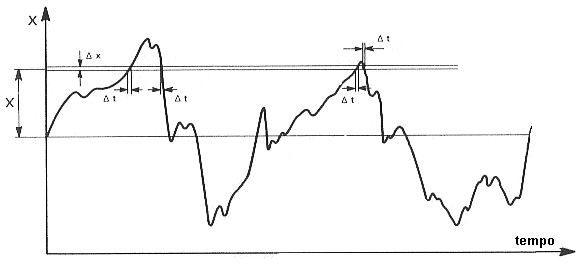
Figure 1.4 Analysis of Distribution of the Amplitude: in this example the
signal crosses 4 times the threshold.
The thresholds are set as percentages of the peak amplitude of the signal in
the track (Maximum Relative Modulation
or MMR) in order to compare different distributions. Since the signal is
regularly sampled "the number of times" is also "how long"
the amplitude of the signal falls within a certain range.
As the audio CD contains a stereo signal we can use the figures of Lissajous
that allow us to view the spatial distribution and to detect the presence of
any restrictions imposed on the amplitude of the signal (signal modulation too
high).
Let
us see two examples concerning a very good record and a poor quality one.
See Figure 1.5. The first figure shows the ASDA of track #2 ripped from the CD "Beethoven - Sonaten"
performed by Emil Giles for Deutsche Grammophon (track "classical").
The quality of this track should be classified as "very good" or “excellent”.
The red and green bars rapresent the two channels (left and right). The numbers
over the bars indicate how many samples of the signal has been detected inside
a particular range. For example, in this track, 11/15 of the total time are
below the 3% of Maximum Relative Modulation (MMR) and only two samples from the
left channel and 19 from the right channel
are between 85 and 100% of MMR for a total time of less than half
millisecond (Figure 1.7).
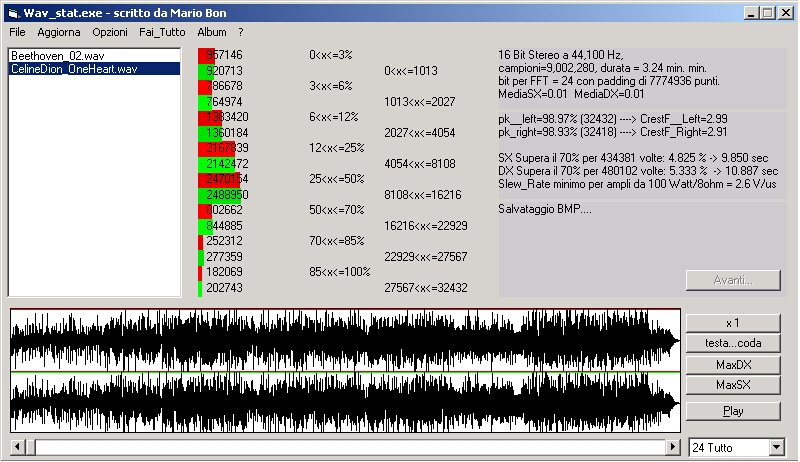
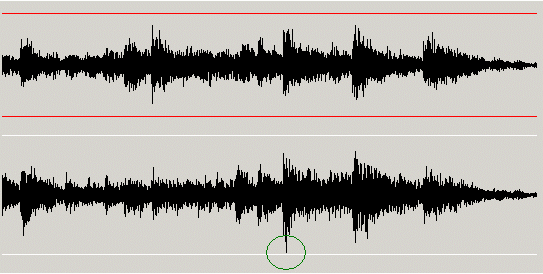
The second track comes from the CD of Celine Dion (One
Heart). In this second case, the crest factor is decidedly low. In this track (
"pop") the largest number of occurrences is concentrated between 12
and 50% of MMR which in this case is very close to Absolute Maximum of
Modulation (MMA). Signals over time are represented with the same amplitude scale
and, by comparison, the signal appears much more intense for the “pop” track .
In the "classical" track, due to low graphic resolution, peaks (very
short) are not visible: a significant segment time is given in figure 1.7 where
you see the peak highlighted by a circle.
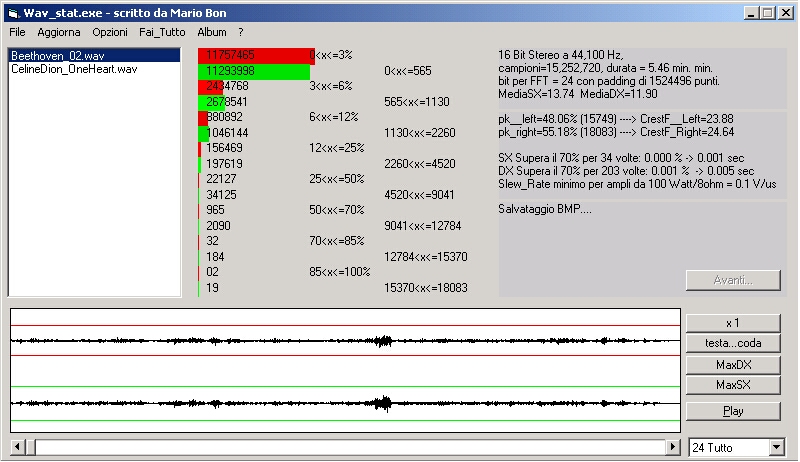
Figura
1.5 ASDA di Beethoven (up) e Celine Dion (down)
The figures of Lissajous of the two tracks (Figure
1.6) show the tendency of the “pop” track
(right) to overcome the limits of the graph. A more accurate analysis of
the “pop” track (Figure 1.8) shows many "clipped" segments. These
saturations are recorded on the CD and they do no coincide with the MMA
(equivalent to 32767) but they are at a slightly lower level (32432). That
means that the clipping was imposed
before the A/D section by a limiter or a compressor.
The quality of a record depends on many factors starting from the expertise of
the performers, the number and arrangement of microphones, the background
noise, the mixing, equalization, compression, until the last step: the
recording into two stereo tracks. The ASDA analysis contains information on the
dynamics (through the crest-factor) and (if any) saturation (or sovramodulation).
The highest value for the crest factor was found equal to 28 (The rite of
Spring – Stravinsky – Telarc). Higher values are found in sample recordings (instruments
in anecoic room).
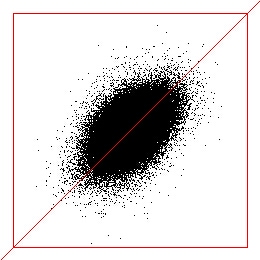
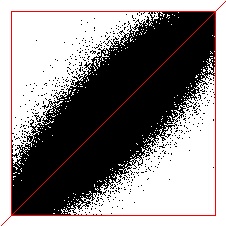
Figure 1.6: Lissajous figures of the two tracks (
"classical" on the left that appears correct, "pop"
right highly clippled). The red
rectangle represents the limit of Absolute Maximum Modulation, the diagonal is
the virtual central channel. The sound quality is very different. The “pop”
track has an high RMS value anl will sound louder whem palyed with an MP3 portable
reader.
Figura
1.7: Beethoven – Traccia 2 – the signal rich is maximum in a single isolated
peak.
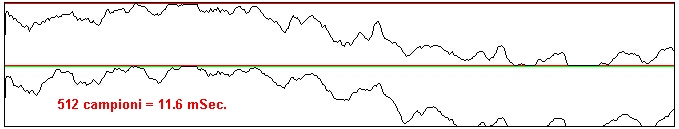
Figura 1.8:
the "pop" track : DX e SX, 512 samples segment with clipping. Anyway it sounds (!)